

- Si bien el precio continúa cayendo, un nivel de soporte significativo en 136,15 dólares podría detener y posiblemente revertir la tendencia.
- Los indicadores presentan señales contradictorias; algunos apuntan a una reversión mientras que otros indican un declive.
solana [SOL] se ha movido lentamente durante la mayor parte del mes, con sólo una ligera ganancia del 3,43%, probablemente debido a la negociación dentro de un canal de consolidación. Sin embargo, en las últimas sesiones de negociación, la lucha ha sido más evidente, con una modesta ganancia semanal del 0,45% y una caída diaria del 2,43%.
Aunque el mercado normalmente espera que SOL caiga aún más, alcanzando el fondo del canal de consolidación entre 128,50 dólares, se deben considerar factores adicionales.
El gráfico SOL presenta una configuración de declive
Según el gráfico de Solana, recientemente reaccionó fuera del nivel de resistencia dentro de su canal de consolidación. Este canal se caracteriza por fluctuaciones de precios entre los niveles de soporte y resistencia establecidos.
Después de rebotar en la resistencia, el precio ha tenido una tendencia a la baja y normalmente se espera que alcance el nivel de soporte en 128,50, un patrón observado en varias ocasiones.
Sin embargo, la formación de una línea de soporte menor dentro del canal de consolidación en 136,15 dólares ofrece potencial para un repunte de Solana si una presión de compra suficiente impulsa este cambio.
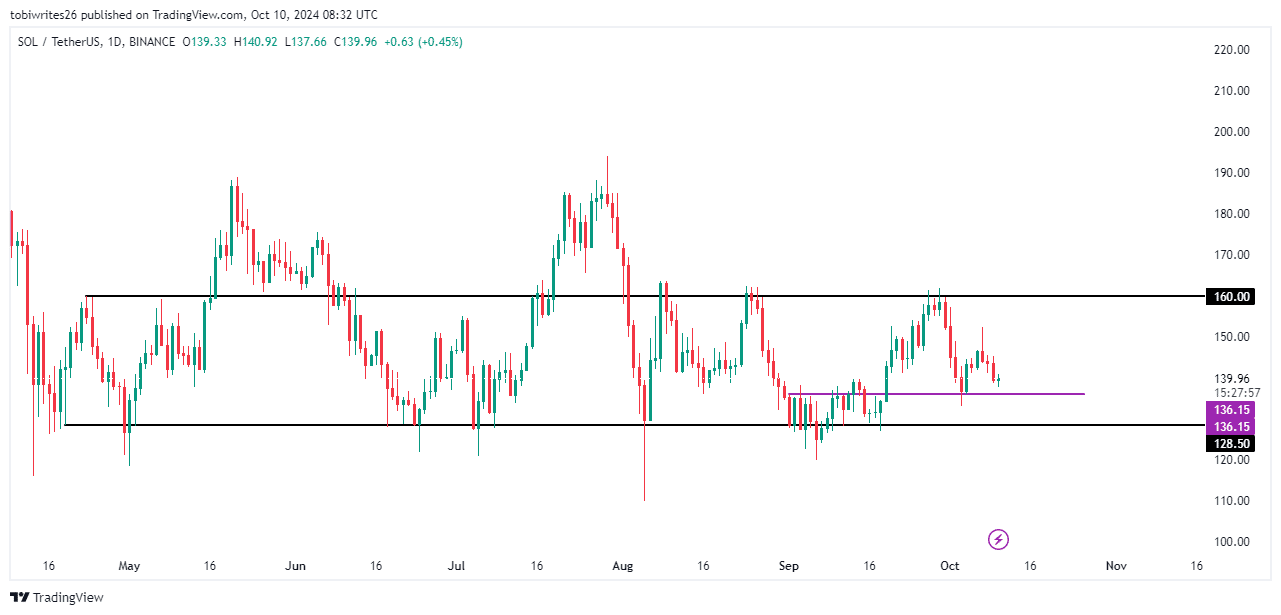
Fuente: Vista comercial
En este punto, AMBCrypto ha observado reacciones variadas en las actividades comerciales, lo que coloca a SOL en una trayectoria algo incierta: si el soporte de 136,15 dólares se mantendrá o no.
Los indicadores señalan una desaceleración para Solana, pero la profundidad no está clara
Los indicadores técnicos insinúan un movimiento bajista continuo para SOL, impulsado por un fuerte sentimiento bajista. En particular, la divergencia de convergencia de la media móvil (MACD) y la línea Aroon están señalando esta posible caída.
El indicador Aroon, que presenta una línea naranja ‘Aroon Up’ y una línea azul ‘Aroon Down’, rastrea el tiempo entre máximos y mínimos para evaluar la fuerza y dirección de la tendencia.
Con la línea Aroon Down actualmente más alta que la Aroon Up, el mercado parece estar en una fase bajista para SOL.
El MACD respalda aún más esta perspectiva, ya que tiene una tendencia a la baja con barras de impulso cada vez más negativas y la línea azul del MACD cruzando por debajo de la línea de señal.
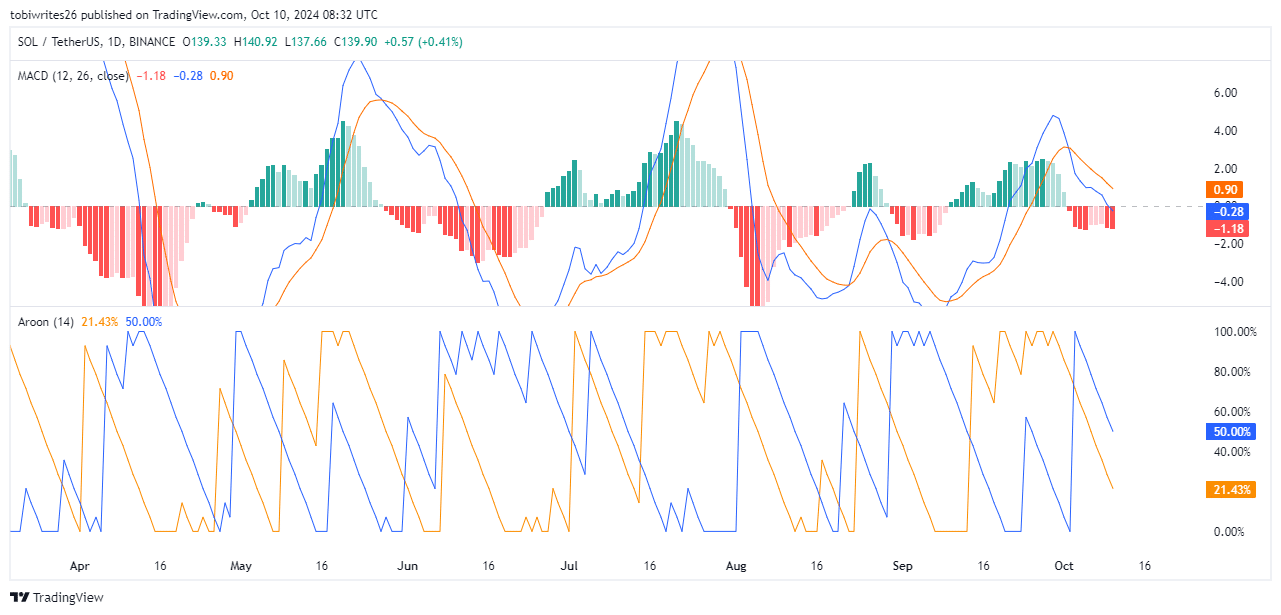
Fuente: Vista comercial
Estas tendencias sugieren que SOL está destinado a caer a medida que se desarrollan más operaciones. El alcance exacto de la caída sigue siendo incierto; Dependiendo de la dinámica futura del mercado, podría estabilizarse en el cercano nivel de soporte de 136,15 o potencialmente caer hasta 128,50.
Mientras tanto, AMBCrypto descubrió que las métricas en cadena indican un creciente sentimiento alcista entre los comerciantes, con un aumento en las posiciones largas y el mantenimiento continuo de las existentes.
La presión de venta sobre SOL disminuye
Según datos en cadena de moneda de vidriola tendencia de SOL a seguir cayendo se ha reducido y la presión de venta está disminuyendo a medida que los alcistas comienzan a tomar el control.
El interés abierto, que rastrea los contratos de derivados no liquidados (contratos de futuros en este caso), ha aumentado un 5,21% a 2.250 millones de dólares. Esto sugiere un aumento en las posiciones largas, lo que podría impulsar el precio hacia adelante.
Leer Solana [SOL] Predicción de precios 2024-2025
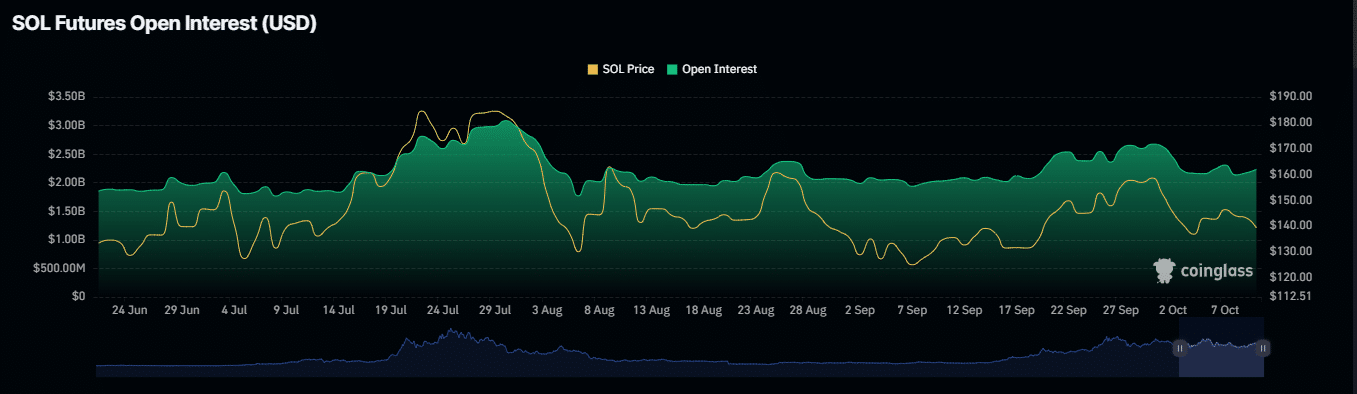
Fuente: Coinglass
Al mismo tiempo, la tasa de financiación se ha vuelto positiva, ahora en el 0,0021%. Una tasa de financiación positiva implica que los operadores en largo están pagando a los operadores en corto, anticipando un aumento de precios.
Si estos indicadores alcistas continúan, SOL podría estar bien posicionado para un repunte, y probablemente se mantenga el soporte más cercano en el nivel de 136,15. Por el contrario, un cambio a negativo podría hacer que SOL caiga al nivel de soporte inferior en 128,50.