

Ripple recientemente enfrentó una importante presión de venta después de ser rechazado en el nivel crítico de resistencia de $ 0,65. Esto resultó en una caída de precios del 23%, por debajo de los promedios móviles de 100 y 200 días.
Esta acción del precio insinúa una posible continuación de la tendencia bajista hacia la marca de 0,5 dólares.
Análisis XRP
Por shayán
El gráfico diario
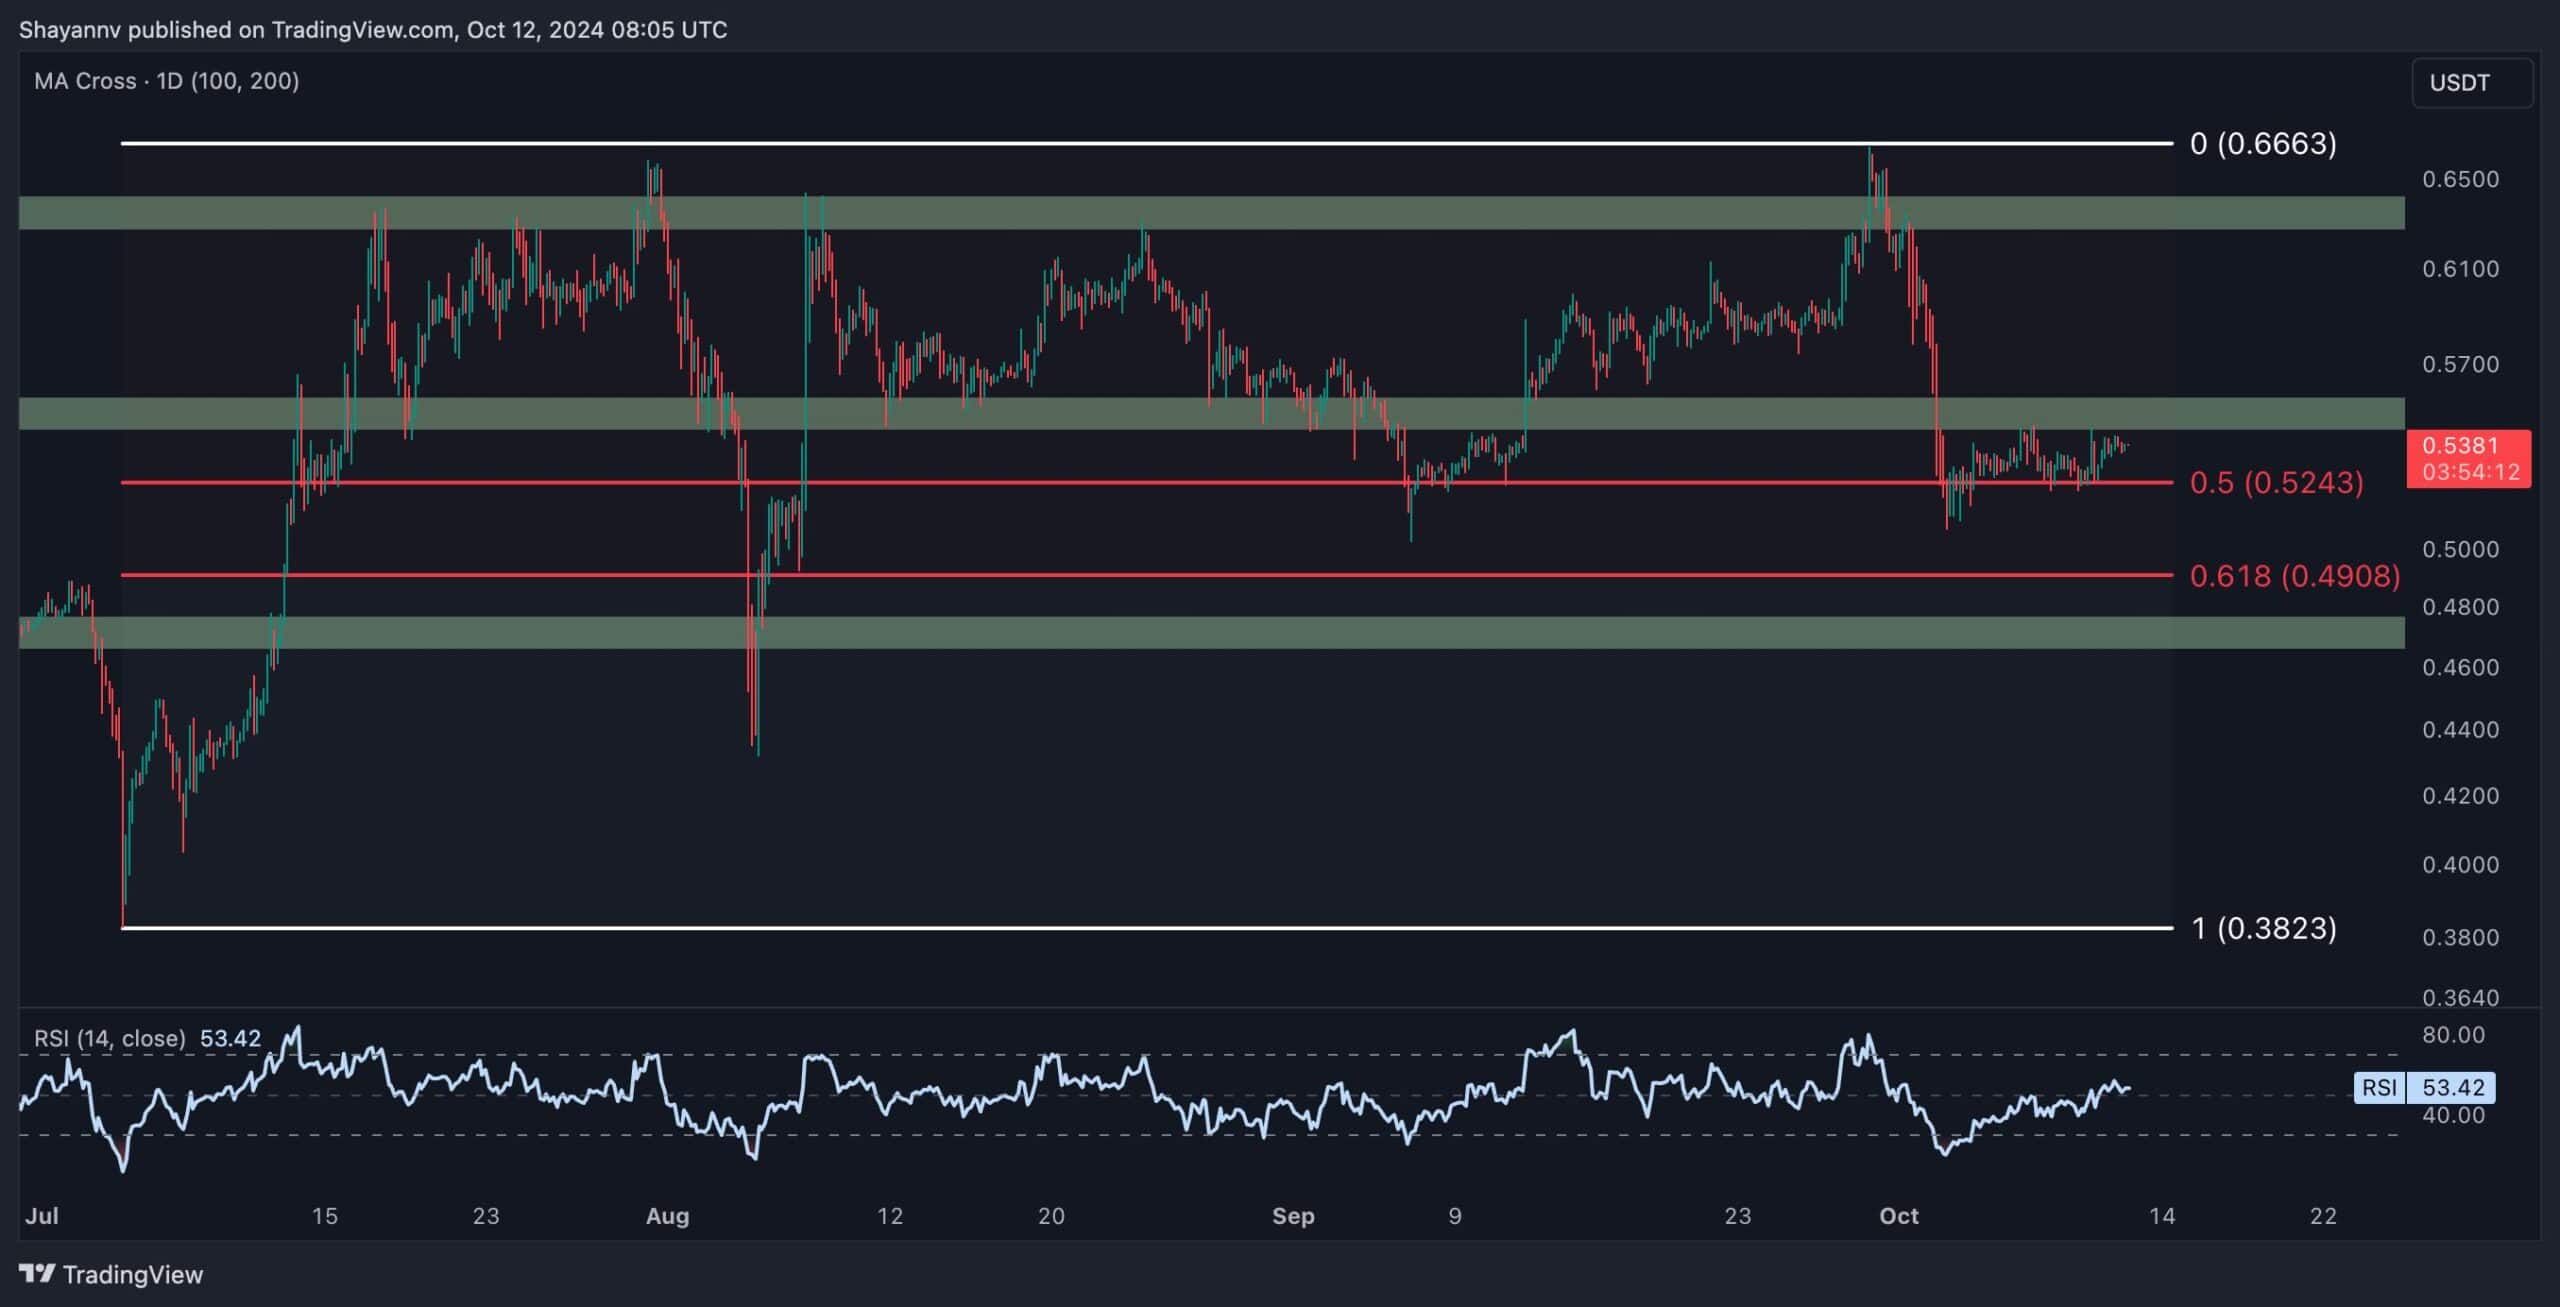
Ripple recientemente encontró una intensa presión de venta luego de un notable rechazo en el nivel crítico de resistencia de $0,65, lo que resultó en una caída del 23%. Esta zona ha rechazado constantemente los avances de los precios en los últimos meses, lo que la convierte en un área de oferta importante. El reciente rechazo hizo que Ripple cayera por debajo de niveles técnicos clave, incluidos los promedios móviles de 100 y 200 días, ambos situados cerca de 0,55 dólares, lo que indica un cambio decisivo hacia el control bajista.
Esta acción del precio se ve acentuada aún más por la caída de XRP por debajo del límite inferior de un patrón de cuña de larga data, lo que refleja una ruptura en la estructura del mercado. La ruptura de estos promedios móviles críticos indica que los vendedores tienen el mando, empujando a la criptomoneda hacia niveles más bajos, con 0,5 dólares emergiendo como la siguiente área de soporte clave.
A pesar de este sólido movimiento bajista, XRP está experimentando un retroceso correctivo marcado por una baja volatilidad, lo que podría indicar un retroceso inminente para probar las regiones rotas cerca de $0,55. Si esto ocurre, probablemente solidificará la tendencia bajista, allanando el camino para una caída continua hacia el soporte de 0,5 dólares.

El gráfico de 4 horas
En el gráfico de 4 horas, el rechazo en la resistencia de 0,65 dólares es evidente, acompañado de una fase de distribución en la que tanto los operadores de dinero inteligente como los minoristas abandonan sus posiciones.
Esta distribución ha provocado la fuerte caída observada en los últimos días, subrayando el dominio de los vendedores en el mercado.
Aunque los alcistas han hecho múltiples intentos de recuperar la resistencia de 0,65 dólares en los últimos meses, la presión de compra ha sido insuficiente para superar la fuerza de venta, consolidando el impulso bajista.
El precio ahora ha caído hacia el rango de soporte crucial definido por los niveles de retroceso de Fibonacci de 0,5 ($0,52) y 0,618 ($0,49). Se espera que esta área actúe como soporte temporal para XRP, ofreciendo la posibilidad de un movimiento correctivo alcista a corto plazo o un período de consolidación lateral antes de que surja una dirección de tendencia clara.
El post Análisis del precio de ondulación: ¿XRP se dirige a $0,5 o $0,6 a continuación? apareció por primera vez en CryptoPotato.